
The (Annual) Slight Q3 Market Volatility
We are in the thick of things this week with about 60% of companies in the S&P 500 already reporting their Q2 results, with some of the bigger players like Apple and Amazon having reported last week.
Beyond the remaining 40% of the S&P 500 yet to release earnings, upcoming is government data on payrolls, inflation, consumer spending, consumer confidence, manufacturing, and more. All this information plays into the Fed decision around rates as well as their quantitative easing (QE) purchase rate.
The data they have seen so far this year has trended in a supporting direction: in their last meeting, they initiated discussions around reducing the QE monthly purchases and have signaled 2 potential rate increases by 2023—a marked change from June when they had forecasted maybe one rate hike by 2023 if not 2024.
A Little More Volatility in Q3
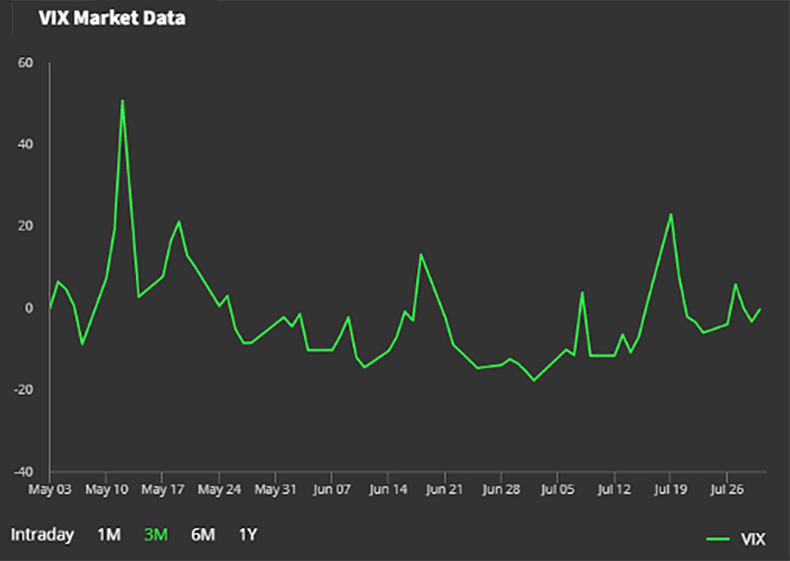
All the while the market has continued to grind higher, albeit, as we noted in our last market commentary, with a bit more volatility since the start of Q3.
In that commentary, Erik highlighted a handful of different narratives to help explain some of the pull-back such as inflation, housing speculation, high stock valuations, and the delta variant of Covid-19, and we can also add the Q3 blues to the list.
Historically, the third quarter is the worst quarter for the market with the blame attributed to summer torpor or a number of people taking vacations, and generally having a last hurrah before September and back to school—“Sell in May and go away”.
 |  |
For those technical analysts out there, it seems like the market is entering a bull flag pattern over the last few weeks and volatility is starting to tick up. This points to some near-term sideways trading with potentially some gains later this year.
Another source that seems to suggest this narrative is the American Association of Individual Investors (AAII) which publishes a weekly sentiment indicator on Wednesdays, and it indicates the average investor echoes the summer soporific feel as both the bulls and bears are below average with a neutral outlook the only thing elevated above the long-term average.
| Overall, it feels like the market is digesting its gains YTD and pondering the new data that is being released. |  |