
Did We Forget About Market Leaders?
The last few weeks have been a big test to those who still maintain faith in the efficient market hypothesis.
Even though companies like Gamestop and AMC are dominating trading volumes and media attention, they are otherwise on the fringes of the economy and the verge of bankruptcy. Nevertheless, the emotion-fueled, cult-like sentiment has created quite the moth flame to drive up trading activity for the whole stock market.
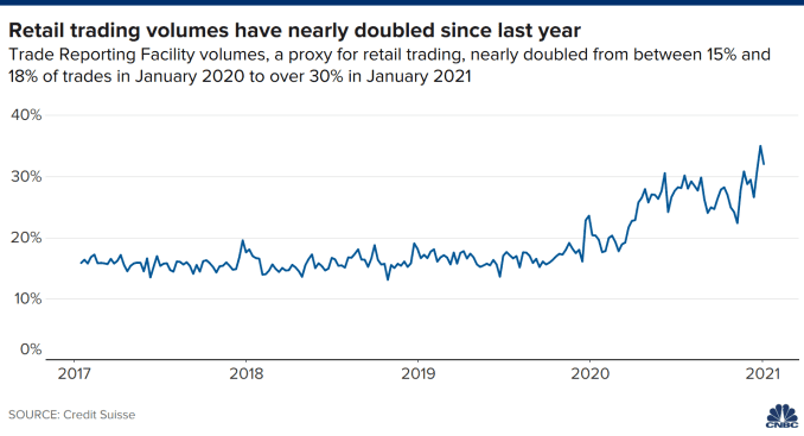
The result is retail trading volumes doubling from this time last year, now accounting for over 30% of overall trading volume. Nearly 3.8MM users downloaded the Robinhood trading App in January alone, which was almost double the highest prior monthly tally, March of 2020, when the first wave of this new investor base entered the market.
Looking for Fundamentals, Not Just Fad
Unfortunately, when things appear “free” on the surface, as they are with the advent of commission-free trading at all the major custodians, the proper consideration of the costs involved with potential losses is sure to be overlooked by many.
We have seen plenty of reckless risk-taking in recent weeks, inarguably driven by the ease and costs to trade. And let us be clear, there is a clear distinction between trading and investing. Hopefully, new entrants to the market will learn that distinction sooner than later.
As it relates to fundamentals for investors, the S&P 500 has already recovered its earnings lost during the COVID-crisis. Fourth quarter earnings are so far up 2% from the fourth quarter of 2019 with over 2/3 of companies, representing 84% of the market cap having reported (from Goldman Sachs Investment Research). This is well ahead of initial estimates.
Tech Titans Continue to Boom, With Less Spotlight
It has also been a while since the spotlight appeared so dim on the tech titans’ quarterly results. But do not worry, they are doing just fine, posting incredible numbers to close out 2020.
As a reminder, the five largest companies (Apple, Microsoft, Amazon, Alphabet/Google & Facebook) make up nearly a quarter of the S&P 500’s market capitalization (size). A concentration that has rarely been higher, and nearly double what it was just five years ago, but for the right reasons. Let’s see how they are doing.
Apple Boasts $100B 4th Quarter and 25% Profit Margin
Apple’s revenue rose 21% in the fourth quarter (its Q1 fiscal), crossing the $100 billion mark for the first time ever. The difference for Apple vs. the other rarified companies that have crossed the $100B threshold is that Apple did it with profit margins of over 25%.
Earnings grew 35% in Q1 as they continue to expand margin through their highly-profitable services segment. Apple also benefited from a better-than-expected release of the iPhone 12.
Microsoft Focuses in on Core Cloud Offerings
Microsoft also continues to do more with less, growing revenues 17% in the fourth quarter, while earnings jumped 34%.
Commercial cloud revenue continues to drive growth, up 34% year-over-year for the quarter-ending December. Microsoft’s high and rising margins also reinforce its defensible moat for its core business lines, including its expanding Office 365 product suite that has its own upside to pricing and margin expansion in future years.
Amazon Blows Past $100B 4th Quarter Benchmark to $125B
Amazon’s quarterly results were overshadowed by the surprise transition for CEO Jeff Bezos to executive chairman role. The fearless leader of Amazon may be on the Mount Rushmore for business CEOs, certainly in the tech industry.
As for its business, Amazon also had its first ever $100 billion quarter with sales jumping 44% YOY to $125B in Q4. Despite the perception that Amazon is a profitless company, we would note that the company generated $31B in free cash flow in 2020, mostly through its highly profitable cloud-based services segment (AWS).
Google's Free Cashflow Nears 30% with 23% YOY Q4 Growth
Alphabet (Google) saw its revenue grow 13% in 2020 and 23% in the fourth quarter. Cloud-based revenue has more than doubled over the past two years, growing 47% in Q4.
YouTube ad revenue was up 46% in Q4 while its core search revenue was up 17%. Once again, the big appeal is just how profitable they can be on their core business, with free cash flow margins near 30%. Besides the Fed, Google’s ad-based revenue may be the closest thing to a cash printing machine.
Facebook Weathers Bad Press and Continues Growth Trend
Facebook is the most popular punching bag of the big 5, with sentiment driving a large gap in performance vs. the others over the past year; however, fundamentals point to a different trend.
Despite such persistent negative sentiment, we still note that daily active users grew 11% year-over-year and ad-based revenue was up 31% in Q4. Operating margin expanded a full 4% in the fourth quarter. Despite the spending increases, the company remains a cash flow machine and one of the two main beneficiaries for online ad spend. Facebook’s stock trades for nearly the same valuation as the broader S&P 500, despite its substantially higher growth, margins, and cash-rich balance sheet.
Fewer Headlines, Plenty of Reasons for Our Attention
The stock reactions were mostly lukewarm to these stellar results, perhaps a “sell the news” sign that the market had been pricing these results in over the past few months. Nevertheless, the fundamentals are very strong for the big 5, which may be boring compared to the thrill of squeezing hedge fund short positions, yet all the more relevant to us.
The opinions voiced in this material are for general information only and are not intended to provide specific advice or recommendations for any individual. To determine which Investment(s) may be appropriate for you, consult your financial advisor prior to investing. Information is based on sources believed to be reliable, however, their accuracy or completeness cannot be guaranteed. Statements of forecast and trends are for informational purposes, and are not guaranteed to occur in the future.
All indices are unmanaged and may not be invested into directly. Advisory services offered through Feltz WealthPLAN, DBA of WealthPLAN Partners. Securities offered through Securities America, Inc., Member FINRA/SIPC. Feltz WealthPLAN and Securities America are separate entities.